Mechanics of Materials with Fractal Microstructures
Faculty Participants
Catalin Picu
Professor
Current and Former Students
Monica Soare
Description
Complexity is ubiquitous in both living and non-living systems. It emerges from the work of nature that develops heterogeneous systems by self-organization resulting in hierarchical structures that extend over multiple spatial scales.
A sub-class of the hierarchical structures includes those exhibiting geometric self-similarity, i.e. the geometry remains statistically identical as the scale of observation decreases (zoom-in). Examples of such fractal materials are the aero-gels, which are produced by aggregation of colloidal particles followed by the evaporation of the suspension fluid (Fig. 1a). Porous materials, such as some rock and the trabecular bone (Fig. 1b) are other examples exhibiting self-similar geometry over a range of scales.
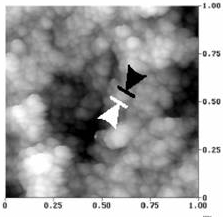 Silica aero-gel
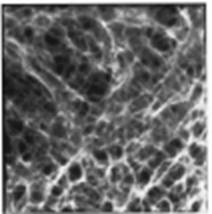 Trabecular bone
Another example is provided by materials with branched internal structure resulting, for example, from dendritic growth. Natural systems with branched structure are the mammalian lung, Fig. 2 Left), and the hierarchical structure of the Gecko lizard foot, Fig. 2 Right).
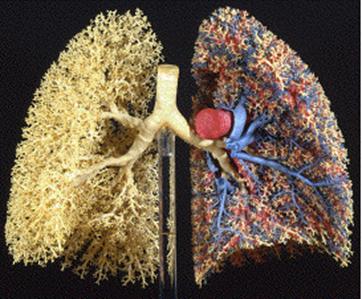 Human respiratory system
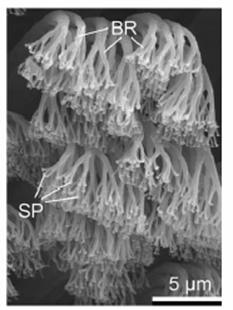 Foot of the Gecko lizard
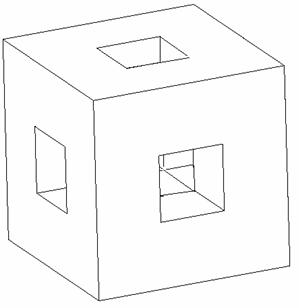
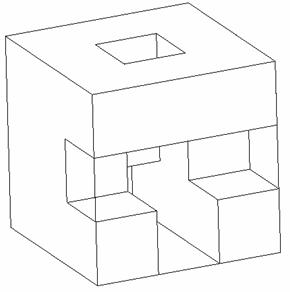
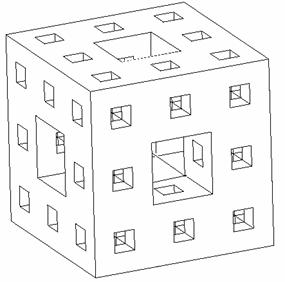
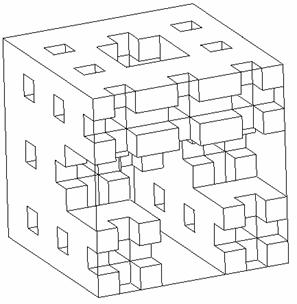
Figure 3 shows another example of a fractal microstructure which is obtained by a applying a mapping from one scale to the next. Two alternatives of applying this mapping are shown: the left column represents the deterministic case, while the right column the equivalent stochastic case. This so-called Menger sponge is obtained by starting with a cube, dividing each edge of it in 3 parts, hence dividing the cube in 27 smaller cubes and then eliminating those placed in the center of each face and in the center of the cube. In the next iteration, this procedure is applied to each of the small cubes that remain in the structure. In the stochastic case (right column), the fraction of cubes eliminated in each steps remains the same, which cubes are eliminated become random.
The behavior of structures with non-decoupling scales cannot be easily predicted with the classical methods of continuum mechanics. For example, homogenization theory cannot be used to determine the overall moduli of aero-gels. For homogenization theory to apply, one needs scale decoupling (homogeneity on scales smaller than that of observation) and an assumption of periodicity (translational symmetry). In principle, one may consider finer and finer discretizations/details until the geometry is fully represented. However, as the number of scales increases, this becomes unfeasible. This appears to be a technology problem rather than a fundamental one. In fact, if the fractal would contain an infinite number of scales (a real hierarchical structure), the problem is clearly un-solvable even conceptually. This stems from fundamental limitations of the continuum field theories.
The goal of this work is to develop formulations adequate for solving boundary value problems defined over fractal microstructures with a large number of relevant scales.
Fractal and spatially correlated composite microstructures
The effect of correlations of the spatial distribution of inclusions in a two-phase composite is studied numerically in this work. Microstructures with fractal distribution of inclusions, characterized by long-range power law correlations, are compared with random inclusion distributions of same volume fraction. The elastic-plastic response of composites with stiff elastic inclusions and elastic-plastic matrix is studied.
Two phase, two-dimensional composites are considered. The matrix fills the Euclidean space of the problem domain. In each realization, inclusions form a fractal which is a generalization of the classical Cantor set to probabilistic structures embedded in 2D. The microstructure is constructed hierarchically by iteratively applying a set of transformation rules.
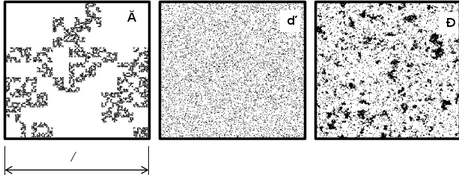
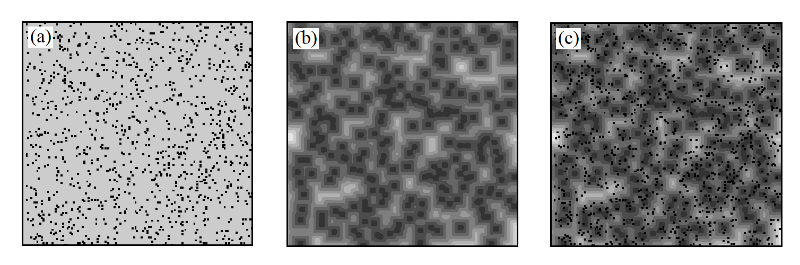
Composites with hierarchical multiscale structure with different distributions of inclusions are presented in Figure 13.The figure shows a microstructure in which inclusions form a fractal (a), a microstructure with randomly distributed inclusions (b), and a microstructure in which inclusions are distributed in a spatially correlated way, with the correlation being exponential.
The mechanical behavior of these composites was studied using finite
element models. The matrix was modeled with a bilinear model (linear
elastic of Young’s modulus \(E_1\)), and linear hardening beyond the yield
stress). Inclusions are considered linear elastic in all cases, with
Young’ s modulus \(6E_1\). The composite has also a bilinear response when
loaded uniaxially. The slope of the elastic region is denoted by \(E_e\)
(effective elastic modulus), while the slope of the stress-strain curve
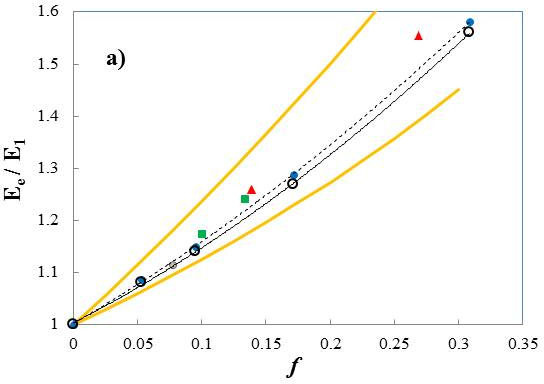
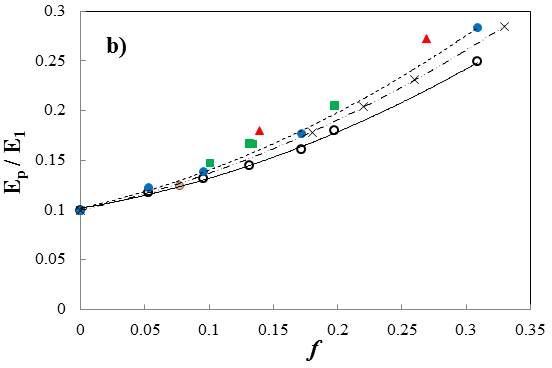
after the yield point is denoted by \(E_p\). Figure 14 shows the effective
moduli \(E_e\) and \(E_p\) for various systems. The open symbols show results
for the random microstructures. Each symbol represents the average of
100 realizations of the respective composite. The various filled symbols
represent results for fractal microstructures. As the fractal dimension
increases, the symbols move farther from the continuous black line which
was fitted to the open symbols. The yellow lines represent the
Hashin-Shtrikman bounds for the random microstructures. In (b), the
crosses represent data for the exponentially correlated microstructures
shown in Fig. 13(c).
It is concluded that the distribution of inclusions has a strong influence on the mechanical response of the composite. As the range of spatial correlations of the distribution increases, the composites are stiffer and strain harden more once in the plastic range.
The damping behavior of these composites has been studied in the second phase of the project. This is relevant for many applications in which composites are used to absorb energy. In such situations, it is useful to inquire how should the inclusions be distributed in order to obtain maximum damping at given volume fraction of filler material. The objective of this section is to provide a quantitative assessment of this issue and to determine the role of the spatial correlation of the distribution of inclusions in defining the damping behavior of the composite.
For subcritical damping, the damping ratio:
\[\zeta_{r} = - \frac{\sigma_{r}}{\sqrt{\sigma_{r}^{2} + \omega_{r}^{2}}}\]
is the ratio between the damping coefficient and the critical damping
coefficient for mode \(r\).
Figure 15 shows the damping ratio for the lowest eigenfrequency mode,
\(\zeta_{1}\), function of the volume fraction of inclusions for various
systems. The open symbols and the thick line correspond to the random
distribution of inclusions, while the other symbols correspond to
fractal microstructures with various fractal dimensions.
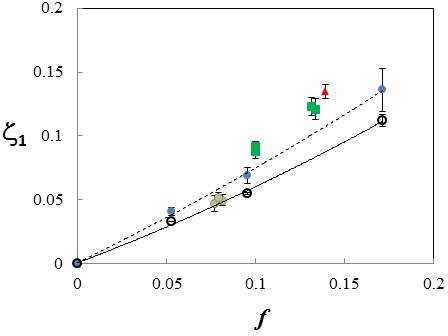
As the fractal dimension increases, the departure from the random case is more pronounced.
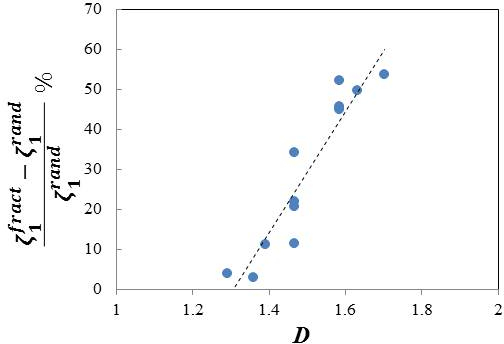
All fractal structures considered exhibit enhancements relative to the corresponding random cases, the increase being function of the fractal dimension. Figure 16 shows the percentage increase of the damping ratio relative to the random case of same volume fraction versus the fractal dimension, for all cases considered.
In conclusion, it is observed that composites with fractal microstructures are stiffer and have larger strain hardening rates, the effect increasing with the fractal dimension. A pronounced effect results when both materials are elastic, but energy dissipation is allowed within fillers. In this case, fractal microstructures dissipate up to 100% more energy than the random microstructures of same filler volume fraction.
Therefore, microstructures with long-range correlated distributions of inclusions are preferable in some applications, as they exhibit significantly different behavior relative to that of composites with random distribution of inclusions. The mechanical response of fractal microstructures depends on the range of scales of the fractal hierarchy and indirectly on the model size.
Effect of fluctuations in local material properties
The goal of the present study is to explore part of the design space associated with the composite composition. To this end, the constraint on the number of constituents in the composite is relaxed and we study the effect on the effective behavior of allowing spatial fluctuations of material properties, while keeping the mean of the distributions of these properties constant.
To this end, we consider three types of model composites (Fig. 17): Type 1 – composites with homogeneous elastic-plastic matrix and linear elastic inclusions of stiffness sampled from a distribution function. The mean of this distribution is kept constant and we investigate the effect of its variance on the homogenized response of the composite; Type 2 – composites with spatial variability in the elastic-plastic material parameters of the matrix, and with no inclusions. Similarly, the mean of the distribution is kept constant and the variable of the problem is its variance; Type 3 – composites of Type 2 in which inclusions are embedded. These inclusions are much smaller than the wavelength of matrix fluctuations and their stiffness is significantly higher than that of the matrix in all cases. All inclusions have the same stiffness in this case. In all models considered, the spatial distribution of inclusions and of matrix property fluctuations are random. This allows separating the effect of variability in the constituent properties from that of the spatial correlations.
For Type 1 composites we observe that Young’s modulus of the composite
decreases with increasing the coefficient of variation of the
distribution of inclusion stiffness, \(c_E\). This variation is shown in
Fig. 18 for two values of the filling fraction, \(f\). We also observe
that the strain hardening rate in the plastic range is not sensitive to
\(c_E\).
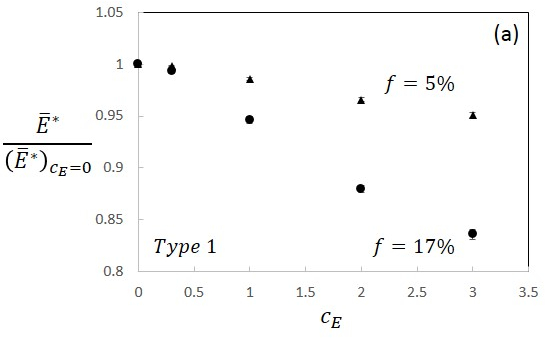
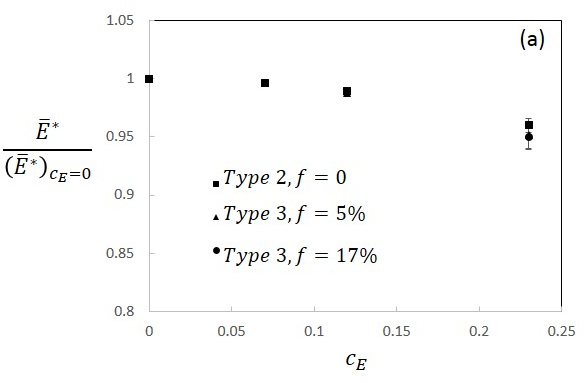
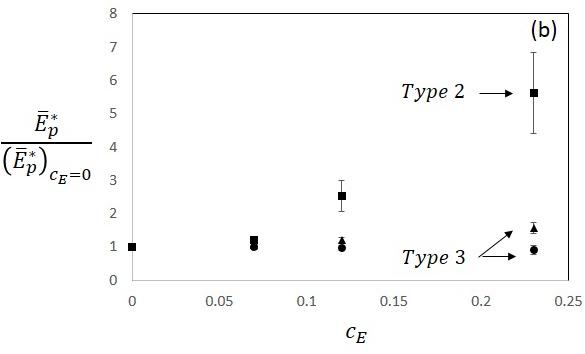
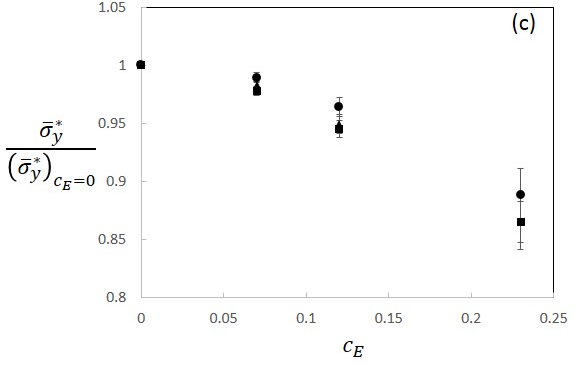
Figure 19 shows the effect of \(c_{E}\) on the effective modulus,
\({\overset{\overline{}}{E}}^{*}\), effective yield stress
\({\overset{\overline{}}{\sigma}}_{y}^{*}\) and effective strain
hardening, \({\overset{\overline{}}{E}}_{p}^{*}\), for Type 2 \((f = 0)\)
and Type 3 (\(f=5%\) and 17%) composites. Figure 19(a) shows the modulus
normalized with the modulus of the composite with no matrix
fluctuations. A much stronger softening effect is observed compared with
the Type 1 case (Fig. 18), with a relative decrease of 5% at a value of
\(c_{E}\) one order of magnitude smaller than that leading to the same
softening as in Fig. 18.
Matrix fluctuations lead to enhanced strain hardening,
\({\overset{\overline{}}{E}}_{p}^{*}\), which increases with increasing
\(c_{E}\) (Fig. 19(b)) for Type 2 composites. This effect is gradually
eliminated when the filler density, \(f\), increases. The effect of matrix
fluctuations on the effective yield stress is strong (Fig. 19(c)).
Fluctuations decrease the yield stress.
In conclusion, allowing spatial variability in the matrix constitutive properties or in the properties of the reinforcing phase leads to the reduction of Young’s modulus, the yield stress and of the strain hardening of the composite.
Publications
- [1]V. Negi and R. C. Picu, “Elastic-plastic transition in stochastic heterogeneous materials: Size effect and triaxiality,” Mechanics of Materials, vol. 120, pp. 26–33, 2018, [Online]. Available at: https://doi.org/10.1016/j.mechmat.2018.02.004.
- [2]Z. Wang, D. Vashishth, and R. C. Picu, “Eigenstrain toughening in presence of elastic heterogeneity with application to bone,” International journal of solids and structures, vol. 144, pp. 137–144, 2018, [Online]. Available at: https://doi.org/10.1016/j.ijsolstr.2018.04.019.
- [3]R. Hull et al., “Stochasticity in materials structure, properties, and processing—A review,” Applied physics reviews, vol. 5, no. 1, p. 011302, 2018, [Online]. Available at: https://doi.org/10.1063/1.4998144.
- [4]Z. Wang, D. Vashishth, and R. C. Picu, “Bone toughening through stress-induced non-collagenous protein denaturation,” Biomechanics and modeling in mechanobiology, vol. 17, no. 4, pp. 1093–1106, 2018, [Online]. Available at: https://doi.org/10.1007/s10237-018-1016-9.
- [5]R. C. Picu, S. Sorohan, M. A. Soare, and D. M. Constantinescu, “Towards designing composites with stochastic composition: effect of fluctuations in local material properties,” Mechanics of Materials, vol. 97, pp. 59–66, 2016, [Online]. Available at: https://doi.org/10.1016/j.mechmat.2016.02.014.
- [6]R. C. Picu, Z. Li, M. A. Soare, S. Sorohan, D. M. Constantinescu, and E. Nutu, “Composites with fractal microstructure: The effect of long range correlations on elastic–plastic and damping behavior,” Mechanics of Materials, vol. 69, no. 1, pp. 251–261, 2014, [Online]. Available at: https://doi.org/10.1016/j.mechmat.2013.11.002.
- [7]R. C. Picu and M. A. Soare, “Mechanics of materials with self-similar hierarchical microstructure,” in Multiscale Modeling In Solid Mechanics: Computational Approaches, World Scientific, 2010, pp. 295–331.
- [8]M. A. Soare and R. C. Picu, “Spectral decomposition of random fields defined over the generalized Cantor set,” Chaos, Solitons & Fractals, vol. 37, no. 2, pp. 566–573, 2008, [Online]. Available at: https://doi.org/10.1016/j.chaos.2006.09.032.
- [9]M. A. Soare and R. C. Picu, “Boundary value problems defined on stochastic self-similar multiscale geometries,” International journal for numerical methods in engineering, vol. 74, no. 4, pp. 668–696, 2008, [Online]. Available at: https://doi.org/10.1002/nme.2191.
- [10]M. A. Soare and R. C. Picu, “An approach to solving mechanics problems for materials with multiscale self-similar microstructure,” International Journal of Solids and Structures, vol. 44, no. 24, pp. 7877–7890, 2007, [Online]. Available at: https://doi.org/10.1016/j.ijsolstr.2007.05.015.